Alternative Prey Hypothesis
Modeling the partially observed Markov process frameowork using a variation of the Lotka Voltera equations
![]()
Full report can be viewed here!
Abstract
Studying population dynamics is essential for understanding the complex interactions between species and their environment. By modeling population dynamics, researchers can gain an understanding of how animals respond to environmental changes and activities. This understanding is vital for conservation efforts as it aids in identifying endangered species and devising strategies to safeguard biodiversity. Furthermore, animal populations can act as reservoirs for infectious diseases, impacting both human and animal health. By comprehensively understanding population movements, scientists can predict outbreaks, discern transmission patterns, and enhance disease control and prevention measures.
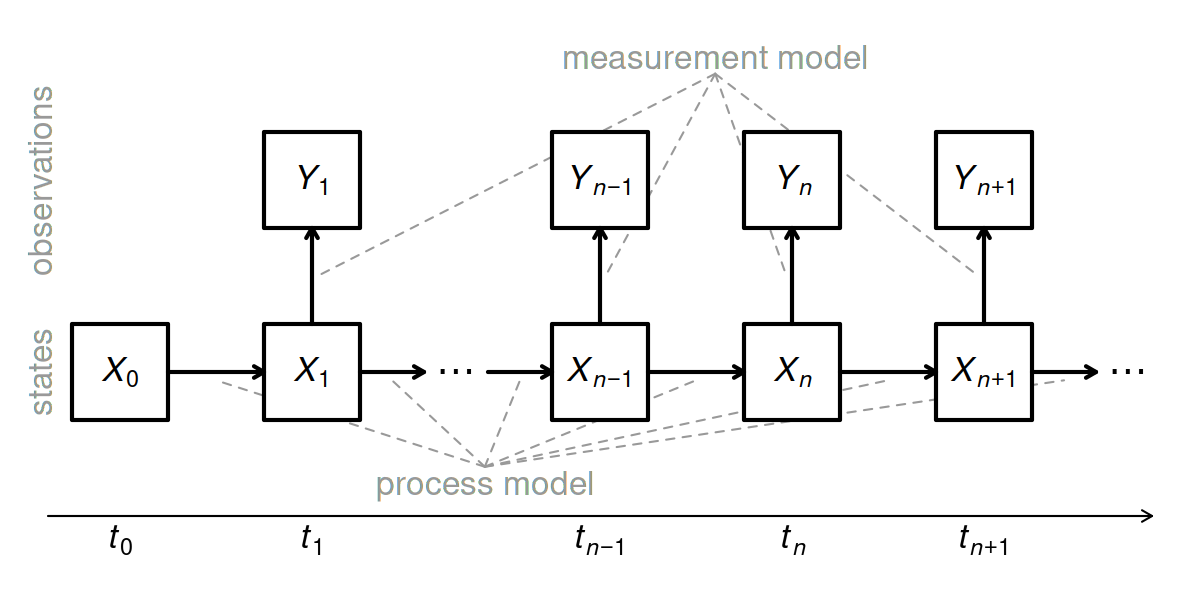
This report extends research by Hjeljord and Loe, who explain the dwindling numbers of willow ptarmigan Lapagos lapagos in Northeastern Scandinavia. Although not in immediate danger, the willow ptarmigan faces threats from habitat loss, climate change, and hunting and trapping. Hjeljord and Loe postulate that, along with climate, a long-term dampening of the amplitude in small rodents and an increase in red fox numbers, have prevented willow ptarmigan populations from reaching their peaks seen a hundred years ago. Their analysis implements linear models with a count proxy as a function of time to estimate linear change and wavelet analysis to detect cyclic periods. This report’s aim is to further Hjelford and Loe’s work by capturing the stochastic population dynamics and the role of alternative prey using the partially observed markov process (POMP) framework. POMP models allow researchers to make inferences about the underlying dynamics of the system by linking observed and unobservable variables. Applications of these models have been carried out extensively in finance and epidemiology, but far less so in ecological systems.
Proposed Model
\[\begin{equation} \log F_{t+dt} = \log F_t + dt(bR_t + c\exp(\log B_t)[1 - \gamma R_t] - a)W_t^F \end{equation}\]
\[\begin{equation} \log B_{t+dt} = \log B_t + dt(\alpha + \beta \exp(\log F_t)[1 - \gamma R_t])W_t^F \end{equation}\]
In the first equation:
- \(\log F_{t+dt}\) is the change in the log of the fox population density over a small time interval \(dt\);
- \(\log F_t\) is the current log fox population density;
- \(bR_t\) represents the fox reproduction rate influenced by the rodent population density \(R(t)\);
- \(a\) represents the fox death rate;
- \(c\exp(\log B_t)[1−\gamma Rt]\) represents the predation rate of foxes on birds, where \(c\) is a parameter representing the efficiency of fox predation, \(\exp(\log B_t)\) is the bird population density, \(\gamma\) is a parameter representing the impact of rodent population on predation efficiency, and \([1−\gamma R_t]\) accounts for the reduction in predation efficiency when the rodent population is high.
- \(W_t^F\) is an integrated gamma white noise variable;
- \(t\) is time.
Similarly, in the second equation:
- \(\log B_{t+dt}\) is the change in the log of the ptarmigan population density over a small time interval \(dt\);
- \(\log B_t\) is the current log ptarmigan population density;
- \(\alpha\) and \(\beta\) represent ptarmigan birth rate and the effect of fox predation on ptarmigan population, respectively;
- \(\exp \log(F_t)\) represents the fox population density influencing bird predation;
- \(W_t^F\) and \(t\) represent the same interpretations as in the first equation.