DynaAlign
DynaAlign is an open-sourced R package designed for scalable protein sequence clustering, visualization, and consensus sequence generation, leveraging high-performance algorithms for large-scale peptide data analysis.
DynaAlign - Scalable peptide sequence clustering and visualization in R 
Key Features
- Scalable Algorithms: Implements Needleman-Wunsch alignment and MinHash approximation for efficient similarity matrix computation.
- Integration with Rcpp: High-performance C++ implementations for critical computational processes.
- Network-Based Clustering: Utilizes the
igraphpackage for modular clustering and visualization of sequence networks. - User-Friendly Outputs: Provides consensus sequences and fine-tuned cluster sizes for downstream applications.
Quick Start
Installation
The package can be installed from GitHub.
# install.packages("devtools")
devtools::install_github("petepritch/DynaAlign")
Overview
DynaAlign addresses the challenge of clustering and analyzing large-scale peptide datasets for applications such as vaccine design and diagnostic assay development. The package integrates two primary similarity computation methods: exact sequence alignment using Needleman-Wunsch with multiple substitution matrices and an efficient, approximate MinHash-based approach. These are combined with network-based clustering via the igraph package, ensuring robust and scalable sequence clustering. Designed with performance and flexibility in mind, DynaAlign enables researchers to extract biologically meaningful insights from massive peptide datasets with unprecedented efficiency.
This software was developed for partial credit BIOSTAT 615 Statistical Computing @ The Univerity of Michigan, Ann Arbor.
Example Usage
# Load sequence data
data(evp_peparray)
sequences <- evp_peparray$PROBE_SEQUENCE

# Create similarity matrix using MinHash
X <- similarityMH(sequences, k = 2, n_hash = 50)

# Plot heatmap
plot_similarity_matrix(X)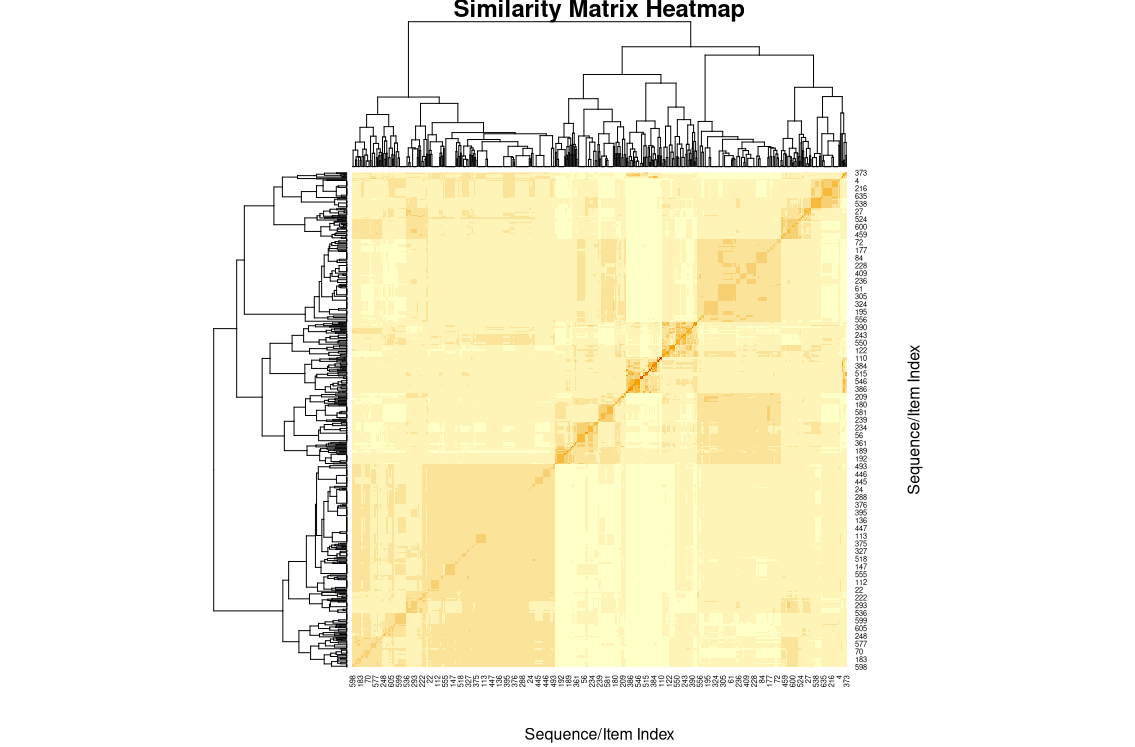
library(dplyr)

# Load data
data(h3n2sample)

# Generate clusters
out.df <- clusterbreak(h3n2sample$sequence[1:1000],
                          size_max = 800,
                          thresh_p = .8,
                          sim_fn = function(x) similarityMH(x,k=4,n_hash=500))

# Generate consensus sequence
consensus_seq <- clusterconsensus(out.df$clustered_seq)

# Default cluster plot
consensusplot(consensus_seq)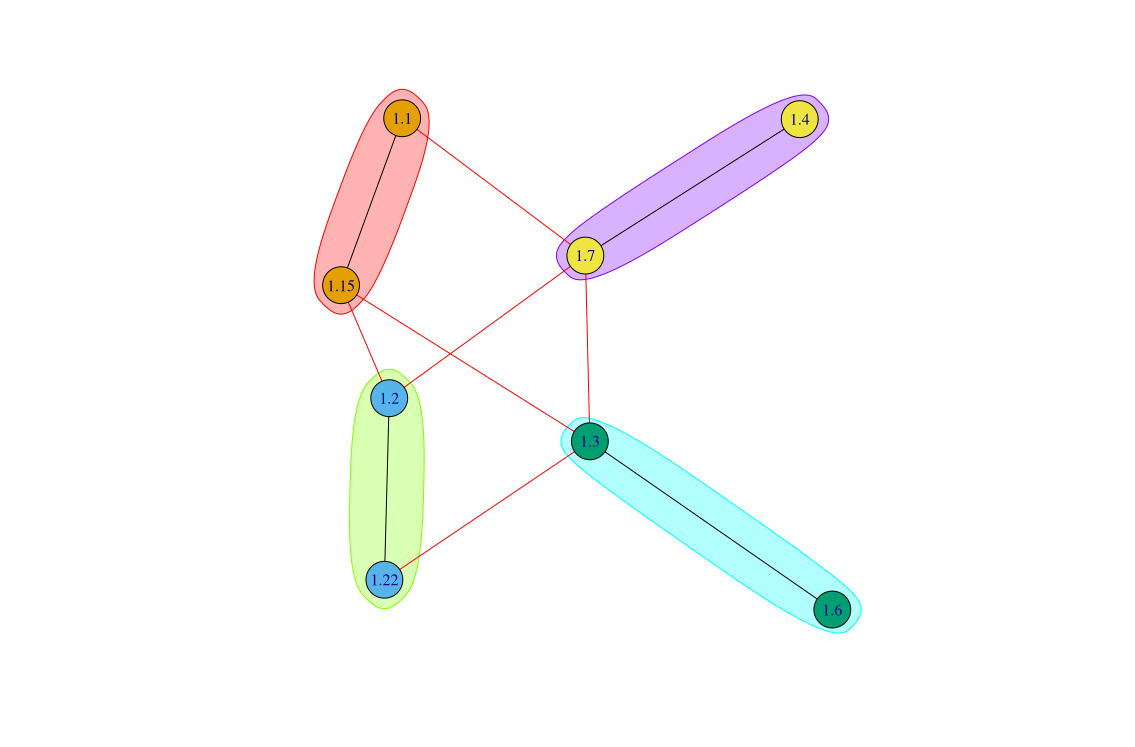
Contributing
- Fork (https://github.com/petepritch/DynaAlign/fork)
- Create your feature branch (
git checkout -b feature/fooBar) - Commit your changes (
git commit -am 'Add some fooBar') - Push to the branch (
git push origin feature/foobar) - Create a pull request
Development
Department of Biostatistics @ The University of Michigan, Ann Arbor